- The routes and levels of service are decided by municipalities, and the service is billed at a predetermined per-kilometer fee. (Metrobus).
- According to the 2019 Metro Bus Review, transportation is reviewed every five to 10 years. According to the same report, only 20% of rider are students (2019)
- According to Metro bus, ridership on the Metro bus was 396,109 in March 2023, up 51% from the same month in 2022 (263,211), 229% from 2021 (120,402), 39% from 2019 (284,309)
- According to the St. John’s Transportation Commission’s March 2023 financial statements, almost 400,000 bus rides were recorded that month.
- Route 2 is the most popular route, with over 80,000 passengers in March. Route 2 made just over $129,00 in March. Route 24 is the least used with far less than 1,000 users in March, and it only made $465 in revenue that month. MUN Express route 26 is one of the least popular. (St. John’s Transportation Commission’s March 2023 financial statement)
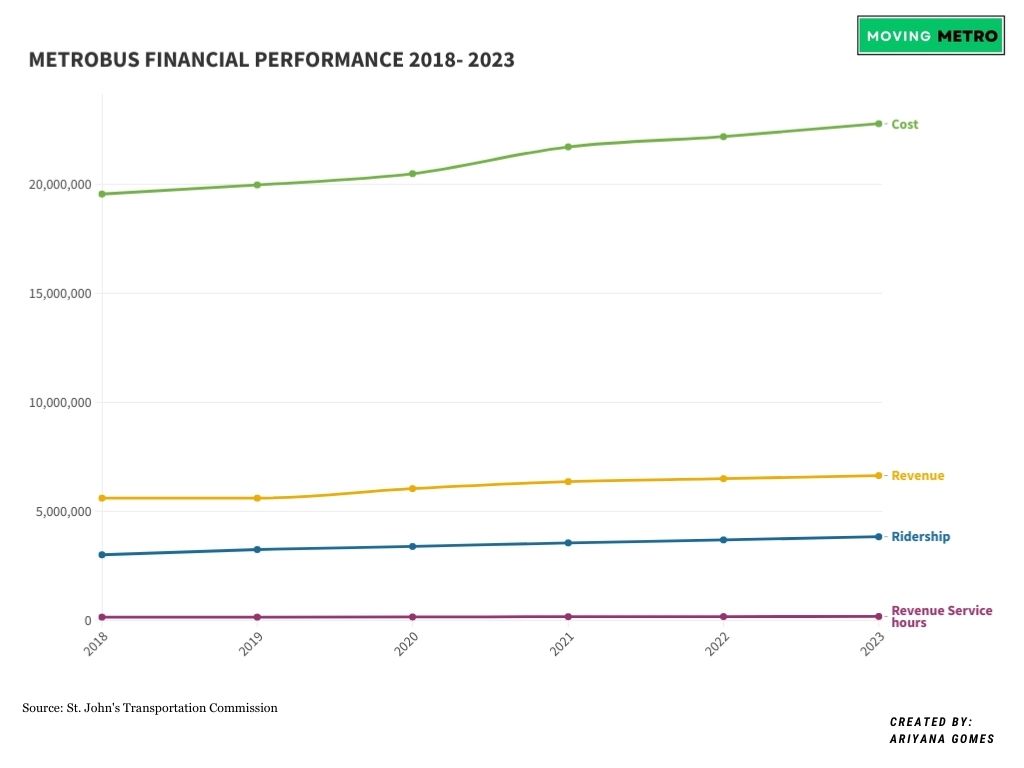
The figure above shows the financial performance of Metrobus (St. John’s public transit system) from 2018 to 2023. According to the graph, the revenues earned in past five years have been relatively unchanged. However, the net operating cost for the fleets increased gradually by three million dollar.
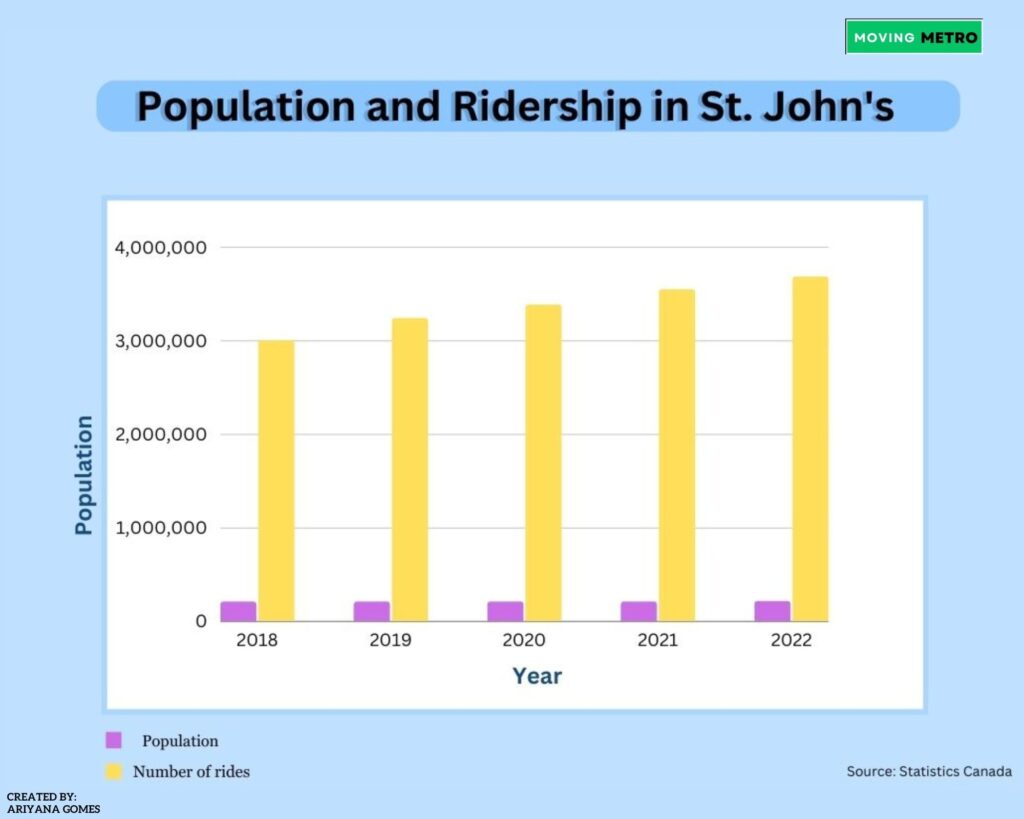
The ridership component in this graph counts rides from Metrobus users per day. Which means, each time a rider takes the bus, it is counted as part of the ridership. This is compared against the population increase in the province from 2018 to 2022.
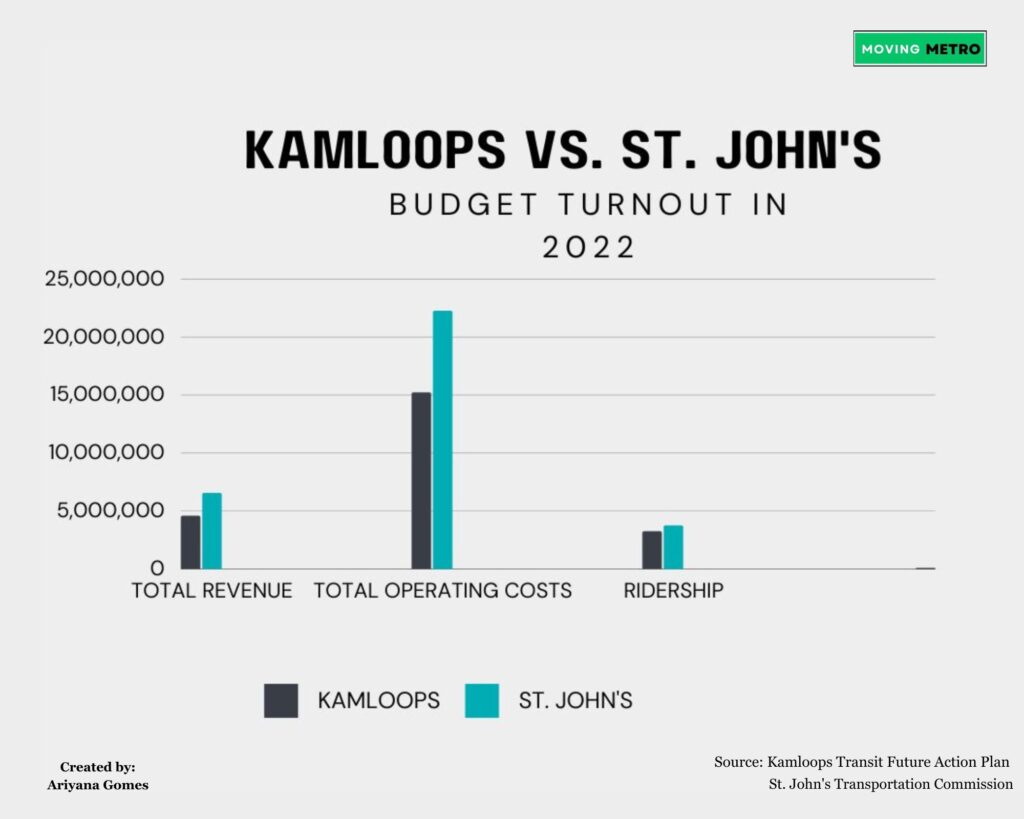
Budget comparison between St. John’s and similar-sized cities in Canada
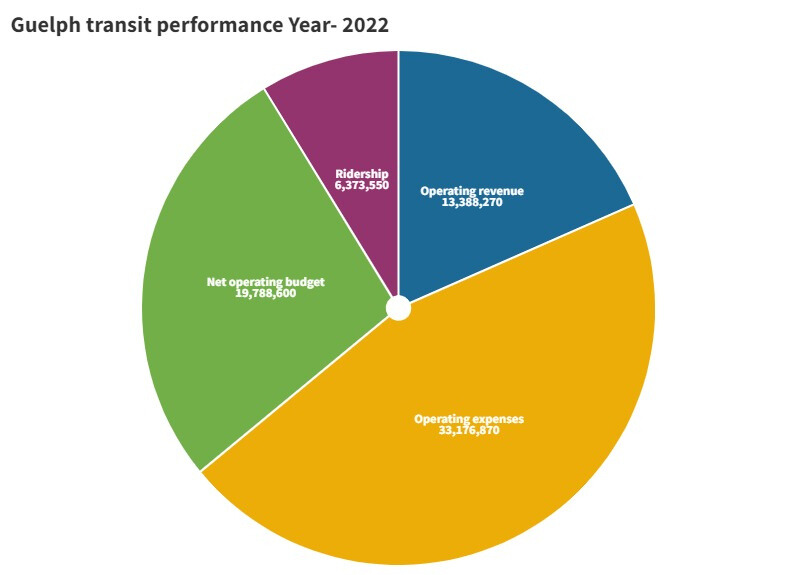
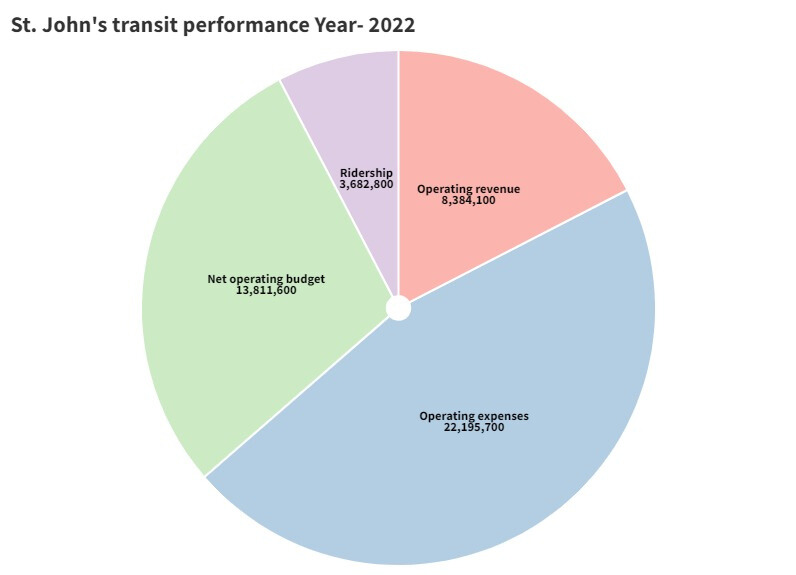
The two figures above compare Guelph and St. John’s transit performance in 2022. The population of city of Guelph in that year was 145,000. And the population of St. John’s was 216,833.